This post is a continuation of the Managing BIOS with Intune series, and is the first of three posts about reporting. The Intune scripts are configured to output information to log files, registry keys, the Intune remediations dashboard, and Azure Log Analytics. This series will cover the available options for working with the output of the Intune scripts.
This post covers what you can do with no extra infrastructure: reading results in the Intune console, exporting them to CSV, and pulling the same per-device run states from Microsoft Graph.
The output line
Every detection and remediation run prints one line as its final action. It is single-line, machine-readable, and always under Intune’s output budget. The shape is always the same:
TAG: component key=value key=value ...
The leading tag is the state at a glance. The component (pw or settings) says which script produced it. The rest is a small set of key=value pairs describing the specifics.
Here are examples from across the scripts:
COMPLIANT: pw v=5 set=true marker-ok
NONCOMPLIANT: pw v=3 set=true marker-version-drift expected=5
NONCOMPLIANT: pw v=- set=false marker-missing
REMEDIATED: pw rotated v=3->v=5
COMPLIANT: settings profile=baseline-v1 managed=10 unsupported=2 failed=0 drift=0
NONCOMPLIANT: settings profile=baseline-v1 managed=10 unsupported=2 failed=0 drift=2 names=WakeOnLan,Virtualization
REMEDIATED: settings profile=baseline-v1 applied=2 compliant=8 unsupported=2 failed-cached=0
SKIPPED: pw out-of-scope (not Dell)
DEGRADED: settings bios-query-failed
The leading tags
The first word reports the overall status of the device. Detection scripts use COMPLIANT, NONCOMPLIANT, and DEGRADED; remediation scripts add REMEDIATED, SKIPPED, and FAILED.
| Tag | Produced by | Meaning |
|---|---|---|
COMPLIANT | Detection | The device is in the desired state. Detection exits 0, so Intune counts it compliant. |
NONCOMPLIANT | Detection | The device has drifted. Detection exits 1, which triggers the remediation. |
REMEDIATED | Remediation | The remediation made a change and confirmed it. |
SKIPPED | Remediation | No action taken; already current, out of scope, or an incompatible device. |
FAILED | Remediation | The remediation tried and could not complete. The device stays flagged for follow-up. |
DEGRADED | Either | The script could not read enough to classify (for example the BIOS WMI query failed). |
out-of-scope (the script ran on a different manufacturer) maps to compliant/skipped and exit 0, so a remediation assigned too broadly doesn’t report false failures.
Password fields (pw)
| Field | Meaning |
|---|---|
v= | The password version on the device, per the on-device marker. - means there is no marker (unknown). |
set= | Whether the BIOS currently has a password set (true / false), read directly from the firmware. |
expected= | The target version, shown when it differs from v=. |
| state word | The specific situation: marker-ok, marker-version-drift, marker-version-future, marker-missing, bios-reset-detected (the marker says a password should be set but the BIOS reports none), marker-needs-clear, marker-ok-cleared, marker-clear-no-bios-pw (the target is cleared and the BIOS already has no password, but no marker records a deliberate clear). |
A REMEDIATED password line names what it did: rotated v=3->v=5, cleared (used v=5 to unlock), or ... via fallback (marker was missing) when it recovered a device whose marker was gone.
Settings fields (settings)
| Field | Meaning |
|---|---|
profile= | The desired-state profile name. A profile change flips devices non-compliant until reapplied. |
managed= | How many settings the script manages on this device (entries in the desired-state table that the BIOS actually exposes). |
unsupported= | Managed settings the BIOS does not expose on this model. |
failed= / failed-cached= | Settings a prior remediation tried and could not apply, cached so they don’t churn every cycle. |
drift= | Managed settings whose current value does not match the desired value. |
names= | The drifted setting names, comma-separated. |
applied= / failed-names= | On a remediation line: how many settings were written, and the names of any that failed. |
blocked= / blocked-reasons= | Present when one or more cached-failed settings failed for a reason that points at blocked management (a wrong/missing password, a thrown write) rather than incompatible hardware. For visibility only, the device still reports its real compliance state. See the reference post for the full reason list. |
mode=nopassword | Present when the run used the settings scripts’ -NoPassword switch (unauthenticated writes). |
Note
mode=nopasswordonly appears on settings output. The password scripts always manage a password, so they have no unauthenticated mode.
Why a single line
Intune surfaces a limited amount of output per run, so the line is built to stay within that budget no matter how many settings drift. The names= list is the only field that can grow, so it is capped: when the list would exceed the budget, it is truncated and ends with +more rather than being cut off mid-name or losing the rest of the line. The leading tag and the counts are always present. For a complete per-setting breakdown, see the next post in this series.
Reading results in the Intune console
The simplest place to see all of this is the remediation itself. In the Intune admin center, open Devices > Scripts and remediations, pick the remediation, and open its Device status. Each device shows its latest pre-remediation and post-remediation output (the lines above) alongside detection and remediation status fields (Without issues / With issues / Issue fixed) you can filter on.
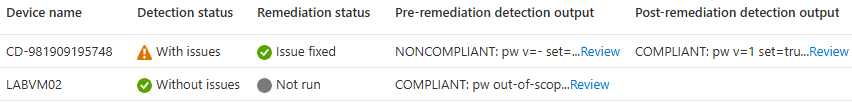
Because the tag leads the line, you can scan the column and immediately get a sense of the state of devices: hopefully a lot of COMPLIANT, a few NONCOMPLIANT, the occasional FAILED or DEGRADED that needs a closer look.
Tip
Sort or filter on the output column to surface the
FAILED/DEGRADEDdevices. Those are the ones that need manual interaction.NONCOMPLIANTshould fix itself on the next remediation cycle.
The local log files
On each device, every detection and remediation run writes a detailed, CMTrace-compatible log that records why it produced that line.
The logs are written to the Intune Management Extension log directory:
C:\ProgramData\Microsoft\IntuneManagementExtension\Logs\
There is one file per script, named after the script. For example Manage-DellBiosSettings-WMI-Detect.log or Manage-DellBiosPasswords-WMI-Remediate.log (the name follows the Manage-<Vendor>Bios<Passwords|Settings>-WMI-<Detect|Remediate> pattern). Putting the logs in the IME log directory means anything that already gathers IME logs picks them up as well. Open them locally with CMTrace, or pull them with Intune’s Collect diagnostics device action.
Each log has the same structure: a start banner with the script version, the configuration it ran with (the profile, the marker paths, whether -NoPassword was used, and whether reporting is enabled), each step as it happened (the manufacturer check, the marker reads, the BIOS query result), the final classification and the reason for it, and the exact STDOUT: line it emitted. Entries are severity-tagged (1 informational, 2 warning, 3 error), allowing a quick filter to surface anything that went wrong.
A FAILED or DEGRADED device is where the logs are most useful: the Intune output line tells you that something went wrong, and the log tells you what (the inner exception message, the step it failed on, the WMI status code). The log entry behind a non-compliant settings line looks like this:
<![LOG[STDOUT: NONCOMPLIANT: settings profile=baseline-v1 managed=10 unsupported=2 failed=0 drift=2 names=WakeOnLan,Virtualization]LOG]!><time="14:02:11.123-300" date="05-31-2026" component="Manage-DellBiosSettings-WMI-Detect" context="NT AUTHORITY\SYSTEM" type="1" thread="4821" file="">
Note
The log path is configurable through each script’s
LogFileparameter, but because Intune remediations cannot take command-line parameters, the default location is the IME Logs directory unless you change the default in the script body.
The registry markers
The scripts keep a small set of registry markers under HKLM:\SOFTWARE\ConfigJonScripts\FirmwareManagement\ so a recurring remediation can remember what it has done between runs (the hub post covers them in detail).
These keys could, in theory, be reported on directly. However, Intune’s current properties catalog does not collect custom registry values, so there is no built-in way to collect this data. The scripts output the data worth reporting from the registry markers into the output line. The markers are reported indirectly, through the scripts, rather than scraped from the registry.
Getting the results out of the console at scale
For more than a handful of devices, the Device status page has an Export button that produces a CSV of every assigned device with all of its columns. This includes the script output (PreRemediationDetectionScriptOutput and PostRemediationDetectionScriptOutput), alongside DeviceName, Model, the join type, the primary user, and the detection/remediation status fields. The data in the CSV can then be parsed using tools like Excel or PowerShell.
For example, to list every device whose latest run failed or degraded using PowerShell:
Import-Csv .\DeviceStatus.csv |
    Where-Object {
        $_.PostRemediationDetectionScriptOutput -match '^(FAILED|DEGRADED)' -or
        $_.PreRemediationDetectionScriptOutput  -match '^(FAILED|DEGRADED)'
    } |
    Select-Object DeviceName, Model, PreRemediationDetectionScriptOutput, PostRemediationDetectionScriptOutput
The same per-device run states are also available programmatically through Microsoft Graph. A remediation is a device health script in Graph, and each device’s latest run state is found under deviceRunStates. Expanding managedDevice pairs the device name with the output line. Using the Microsoft Graph PowerShell SDK:
# Microsoft.Graph.Authentication module; read-only scope
Connect-MgGraph -Scopes 'DeviceManagementConfiguration.Read.All'

# Remediation ID: open the remediation under Devices > Scripts and remediations; the ID is in the browser URL after id/
$remediationId = '00000000-0000-0000-0000-000000000000'
$uri = "https://graph.microsoft.com/beta/deviceManagement/deviceHealthScripts/$remediationId/deviceRunStates?`$expand=managedDevice"

(Invoke-MgGraphRequest -Method GET -Uri $uri).value |
    Select-Object `
        @{ Name = 'DeviceName'; Expression = { $_.managedDevice.deviceName } },
        detectionState,
        remediationState,
        @{ Name = 'Output'; Expression = { $_.preRemediationDetectionScriptOutput } } |
    Format-Table -AutoSize
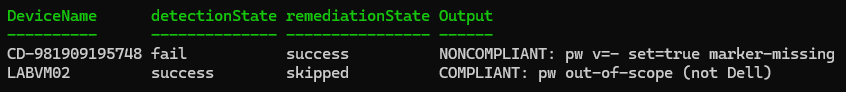
preRemediationDetectionScriptOutput is the same single line you see in the console. The endpoint is in the Graph beta profile.
The CSV export and Graph share one limit: both can only ever carry the single output line, capped at Intune’s budget. You can search on the tag and parse the key=value fields out of the string, but you cannot see anything the line did not have room for. This includes the per-setting detail behind names=...,+more. That is where the Log Analytics solution comes in.
Structured data with Log Analytics
The output line, the CSV export, and Graph get you a long way, but all three are bounded by that single line. When you want the full picture (a row per managed setting, desired vs current values, device details, drift history you can chart over time) the scripts can push structured records straight to Log Analytics over the Logs Ingestion API, into custom tables you query with KQL. This is an opt-in feature, off by default, and it needs a bit of Azure setup first. The next two posts cover it end to end.