This is the second post in the Intune BIOS Reporting series. The first post, Reporting on BIOS management with Intune, covered what you can do with no extra infrastructure. This one builds the Azure infrastructure that lets the detection scripts push structured records to Log Analytics over the Logs Ingestion API. This is a one-time setup. It is the longest post in the series because there are several moving parts.
Turning the feature on in the scripts, the data model, the costs, and the queries are all covered in the next post, Querying BIOS fleet data with Log Analytics and KQL.
What to build
The push pipeline needs four things in Azure, plus one certificate:
- A Log Analytics workspace - where the data is stored.
- A data collection endpoint (DCE) - where endpoints upload data.
- Two custom tables under one data collection rule (DCR) -
BiosManagementRun(one row per run) andBiosSettingsDetail(one row per managed setting), joined by aRunId. - An Entra app registration - the identity the scripts authenticate as.
- A client-authentication certificate - how that identity proves itself, with no shared secret in the script.
The device-side script then authenticates as the app using the certificate and POSTs its records to the DCE, which routes them through the DCR into the tables.

Note
Keep every resource in the same Azure region. The DCE, DCR, and workspace must agree on region, and mixing them is a common cause of “works in the portal, fails at ingest.” The examples below use one region throughout.
Caution
Do not enable Microsoft Sentinel on this workspace. Sentinel changes the billing model for the workspace and is unnecessary for this solution.
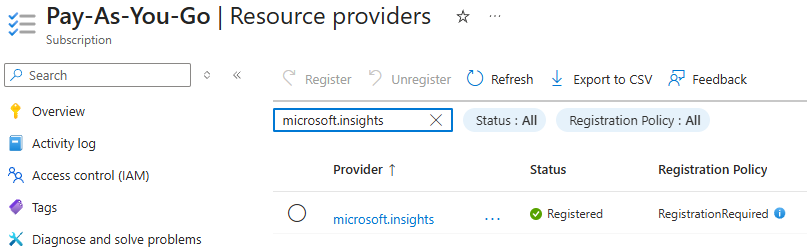
Step 1 - Register the Microsoft.Insights resource provider
Data collection endpoints and rules live under the Microsoft.Insights resource provider. On a subscription that has never used it, creating a DCE fails with a “not registered to use namespace ‘microsoft.insights’” error. Register it first.
In the Azure portal, open Subscriptions > (your subscription) > Settings > Resource providers, search for Microsoft.Insights, and click Register. It takes a minute or two to move from Registering to Registered.
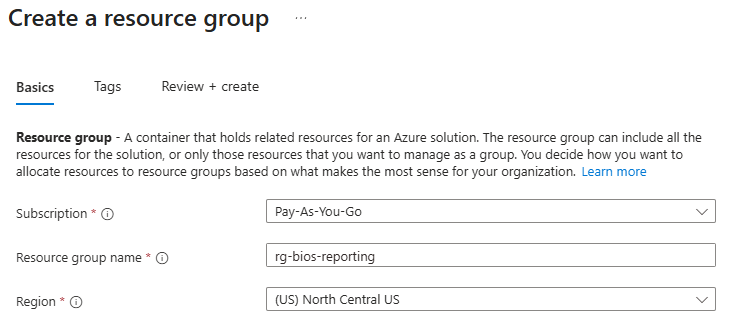
Step 2 - Create a resource group
Everything for this solution goes in one resource group, which keeps it easy to find and easy to remove. Create a resource group (this series uses rg-bios-reporting) in your chosen region.
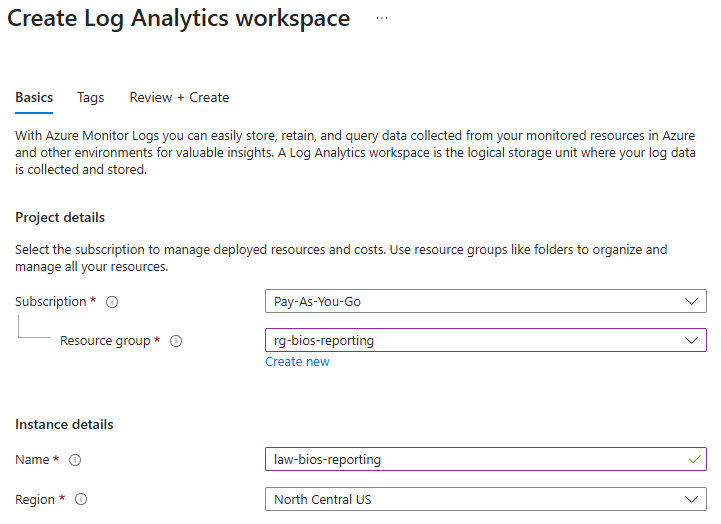
Step 3 - Create the Log Analytics workspace
Create a Log Analytics workspace (this series uses law-bios-reporting). Select the just created resource group and matching region.
Step 4 - Create the data collection endpoint
The DCE is the HTTPS endpoint the scripts POST to. It has to exist before you create the custom tables, because the table-creation wizard will ask you to pick one and does not offer to create it inline.
Search the portal for Data collection endpoints, click Create, and make a DCE (this series uses dce-bios-reporting). Select the matching resource group and region.
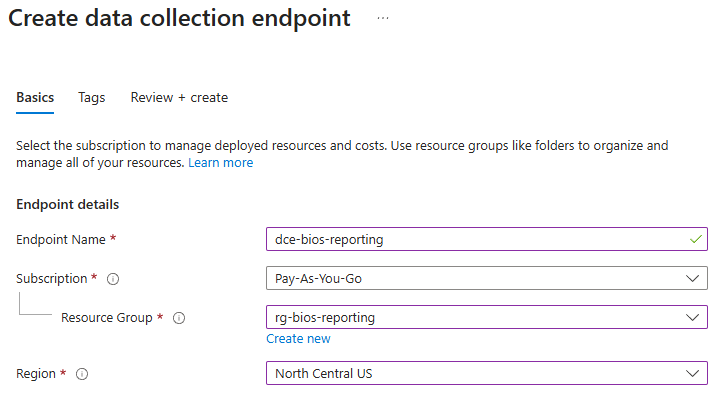
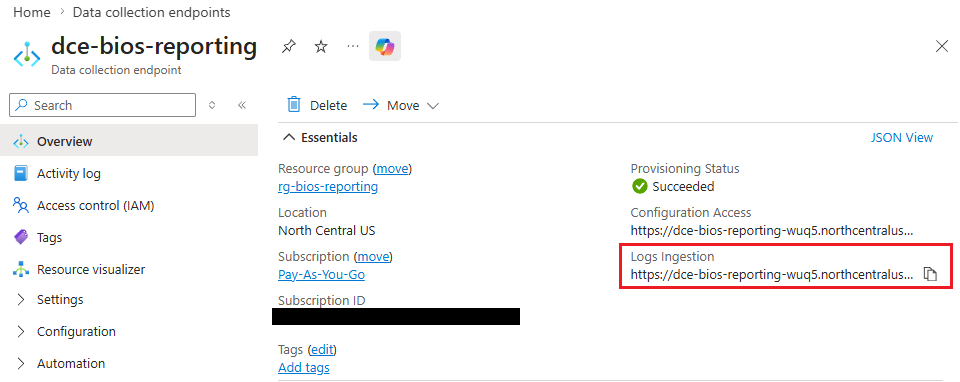
Once the DCE is created, open it and note its Logs ingestion URI on the Overview page (it looks like https://dce-bios-reporting-xxxx.<region>.ingest.monitor.azure.com). You will need it later as the DceUri value.
Step 5 - Create the two custom tables
Both tables are DCR-based custom logs, and you will create one DCR that serves both. The order matters: create the first table with a new DCR, then create the second table pointing at that existing DCR, so both streams live under one rule.
The table schemas
Each table is defined from a small sample JSON record in the wizard. The column names and types are inferred from it. DCR-based custom tables keep your field names exactly as written, so what you put in the sample is what you query later.
BiosManagementRun - one row per detection emission. Sample:
[
  {
    "TimeGenerated": "2026-05-31T00:00:00.000Z",
    "DeviceName": "PC-0001",
    "DeviceId": "00000000-0000-0000-0000-000000000000",
    "Manufacturer": "Dell Inc.",
    "Model": "Latitude 5430",
    "Component": "Settings",
    "Profile": "baseline-v1",
    "DesiredStateHash": "0f1e2d…",
    "ScriptVersion": "1.0.0",
    "Mode": "normal",
    "OverallTag": "NONCOMPLIANT",
    "ManagedCount": 10,
    "CompliantCount": 8,
    "DriftCount": 1,
    "UnsupportedCount": 1,
    "FailedCount": 0,
    "BlockedCount": 0,
    "DriftNames": "WakeOnLan",
    "PasswordVersion": 0,
    "CertThumbprint": "",
    "RunId": "11111111-1111-1111-1111-111111111111"
  }
]
BiosSettingsDetail - one row per managed setting. Sample:
[
  {
    "TimeGenerated": "2026-05-31T00:00:00.000Z",
    "DeviceId": "00000000-0000-0000-0000-000000000000",
    "RunId": "11111111-1111-1111-1111-111111111111",
    "SettingName": "WakeOnLan",
    "DesiredValue": "LanOnly",
    "CurrentValue": "Disabled",
    "PerSettingStatus": "Drift",
    "FailReason": "",
    "Managed": true,
    "SetDate": "2026-05-31T00:00:00.000Z"
  }
]
Important
TimeGeneratedmust be present in both samples. Keep the field names and types exactly as shown; the device scripts emit these names, and a mismatch means the record is dropped at ingest.
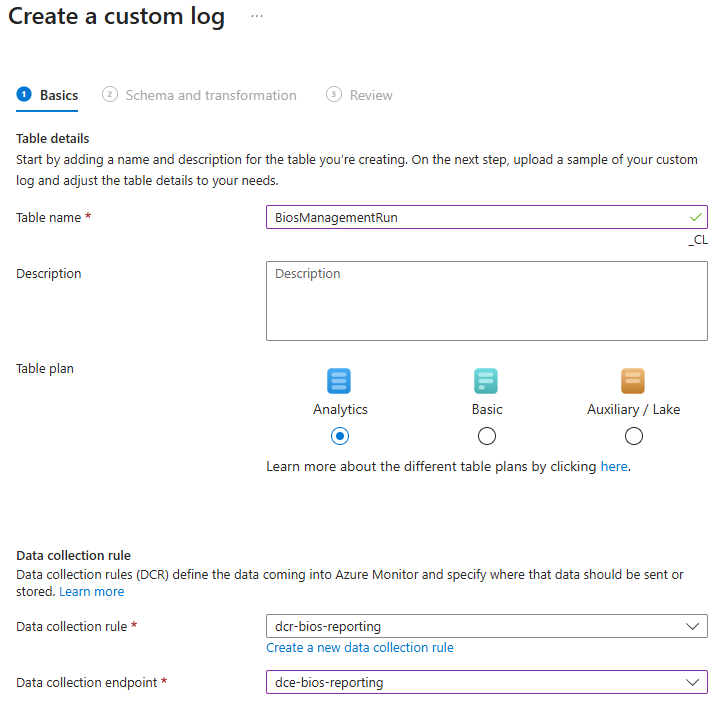
Creating the first table (BiosManagementRun)
Open your Log Analytics workspace, go to Settings > Tables, and choose Create > New custom log (DCR-based). In the wizard:
- Table name:
BiosManagementRun. The portal appends_CLautomatically, so the table becomesBiosManagementRun_CLand its ingestion stream becomesCustom-BiosManagementRun_CL. - Table plan: Analytics (the default).
- Data collection rule: create a new one here (this series uses
dcr-bios-reporting). - Data collection endpoint: pick the DCE from Step 4.
- Schema / sample: upload the
BiosManagementRunsample JSON above. Leave the transformation as the default pass-through (source).
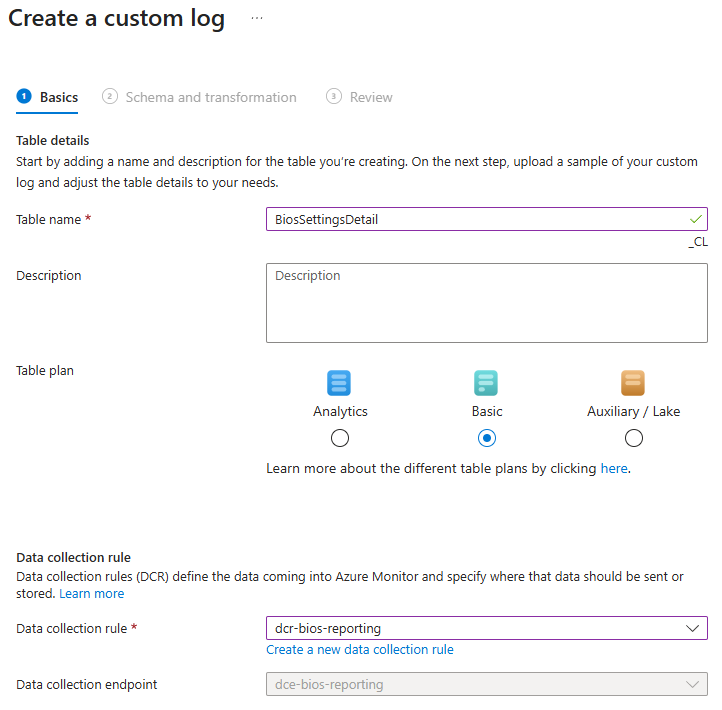
Creating the second table (BiosSettingsDetail)
Repeat Create > New custom log (DCR-based), but this time:
- Table name:
BiosSettingsDetail(becomesBiosSettingsDetail_CL, streamCustom-BiosSettingsDetail_CL). - Table plan: Basic. This is the larger, occasionally-queried table, so it goes on the cheaper plan.
- Data collection rule: select the existing
dcr-bios-reportingyou just made, so both streams share one rule. - Data collection endpoint: the same DCE.
- Schema / sample: the
BiosSettingsDetailsample JSON above.
Why the two tables use different plans
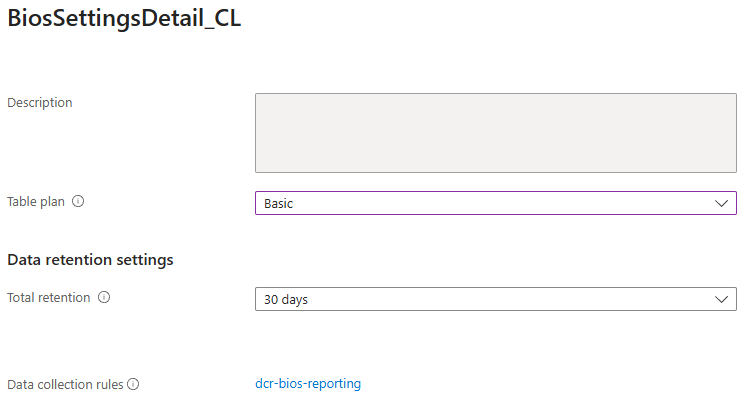
Log Analytics lets you bill tables differently based on how they’re used. The summary table (BiosManagementRun_CL) stays on the Analytics plan: it’s small, queried often, and feeds dashboards. The detail table (BiosSettingsDetail_CL) is larger and queried only occasionally, so the Basic plan you selected above gives it much less expensive ingestion.
If you missed the plan selection during creation, you can change it afterward under Settings > Tables: open BiosSettingsDetail_CL, choose Manage table, and set the table plan to Basic.
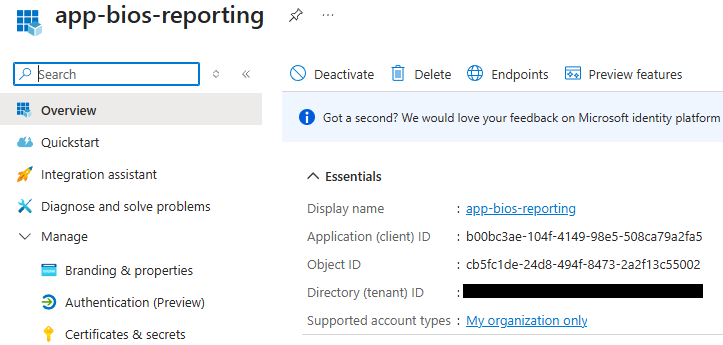
Step 6 - Register the Entra application
The scripts authenticate as an Entra app. In Microsoft Entra ID > App registrations > New registration, create one (this series uses app-bios-reporting). It needs no redirect URI and no API permissions. It uses client credentials and is authorized through a role assignment on the DCR, not through Graph permissions.
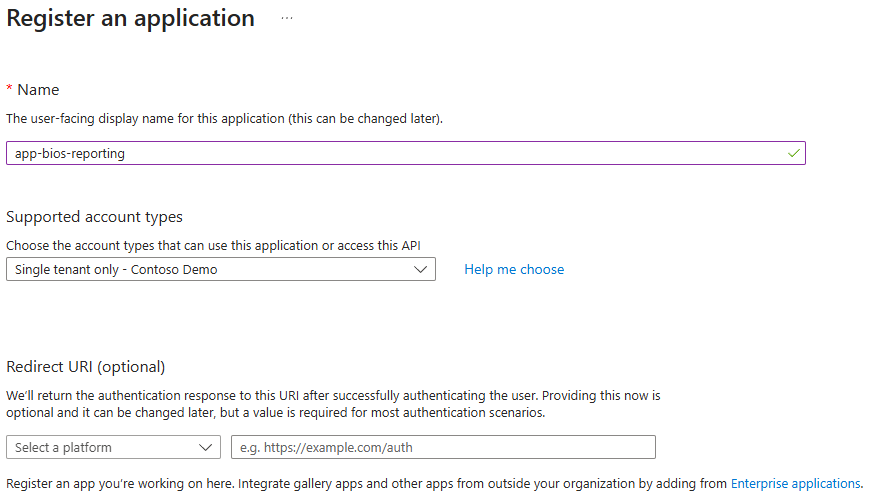
From the app’s Overview, record two values for later:
- Application (client) ID
- Directory (tenant) ID
Step 7 - Create and attach the client-authentication certificate
The app proves its identity with a certificate, so there is no client secret to leak. This is a separate certificate from the CMS document-encryption certificate used to deliver BIOS passwords.
Create a dedicated client-authentication certificate. A self-signed one is fine for this purpose (enterprise PKI works too):
$cert = New-SelfSignedCertificate `
    -Subject "CN=BIOS Reporting Ingestion" `
    -CertStoreLocation "Cert:\LocalMachine\My" `
    -KeyExportPolicy Exportable `
    -KeySpec Signature `
    -KeyUsage DigitalSignature `
    -TextExtension @("2.5.29.37={text}1.3.6.1.5.5.7.3.2") `
    -NotAfter (Get-Date).AddYears(2)

# Public key (.cer) - upload this to the app registration
Export-Certificate -Cert $cert -FilePath ".\BiosReportingIngestion.cer"

# Public + private key (.pfx) - used to deploy the cert to devices
$pfxPassword = Read-Host -AsSecureString "PFX password"
Export-PfxCertificate -Cert $cert -FilePath ".\BiosReportingIngestion.pfx" -Password $pfxPassword
Attach the public key to the app: in the app registration, open Certificates & secrets > Certificates > Upload certificate and upload the .cer. The thumbprint shown there is the CertThumbprint the scripts use.
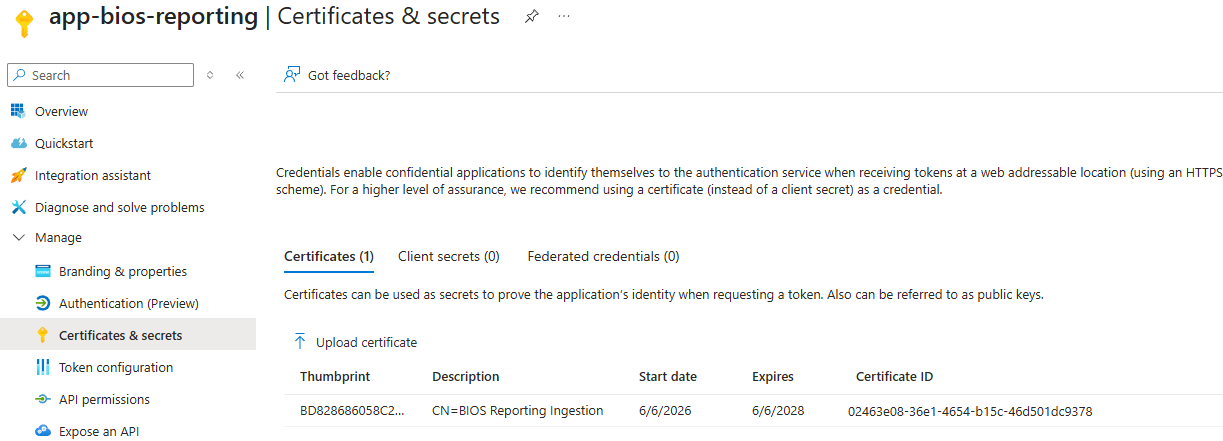
Important
Only the public key (
.cer) is uploaded to the app. The private key is deployed to your devices, exactly like the CMS certificate: imported intoCert:\LocalMachine\Mywith a non-exportable private key, readable by SYSTEM. The device-deployment mechanism (an Intune platform script or Win32 app that imports the.pfx) is the same one described in Setting up BIOS password certificates in Intune. Reuse that same pattern for this certificate.
Caution
The script runs as SYSTEM, so the private key in
Cert:\LocalMachine\Mymust be readable by SYSTEM.
Step 8 - Authorize the app to ingest
The app needs permission to send data through the DCR. This is a role assignment on the DCR, not a Graph permission.
Open the data collection rule (dcr-bios-reporting), go to Access control (IAM) > Add role assignment, choose the Monitoring Metrics Publisher role, and assign it to the app registration’s service principal (app-bios-reporting).
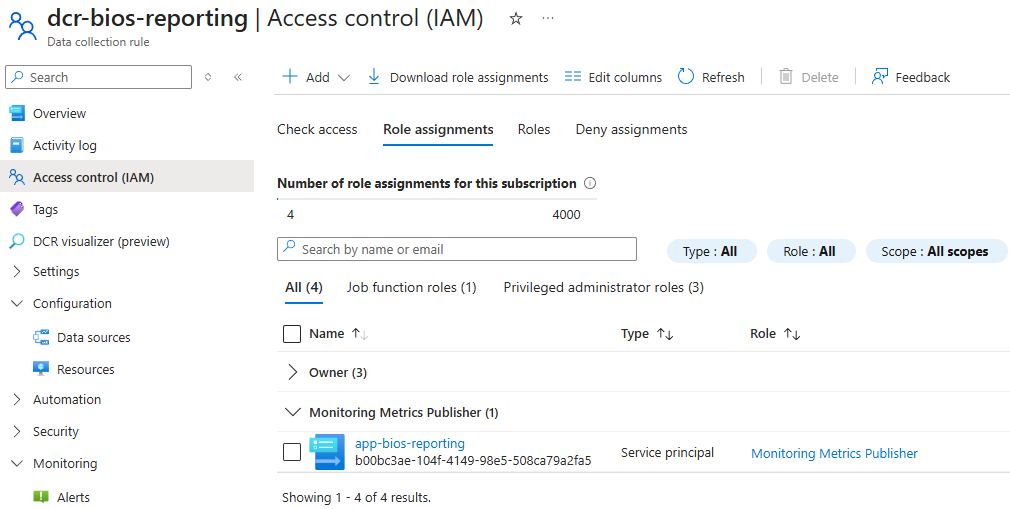
Note
Role assignments can take a few minutes to propagate. If the first ingest attempt returns a 403 right after you assign the role, wait a moment and try again before assuming something is misconfigured.
Step 9 - Collect the configuration values
The infrastructure is now built. Before moving on, gather the values the scripts will need. They all go into a $ReportingConfig block in the script body (none of them are secret; the certificate’s private key is the only secret, and it never appears in the script).
| Config value | Where to find it |
|---|---|
TenantId | App registration > Overview > Directory (tenant) ID. |
ClientId | App registration > Overview > Application (client) ID. |
CertThumbprint | The thumbprint of the client-auth certificate (Step 7). |
DceUri | DCE > Overview > Logs ingestion URI (Step 4). |
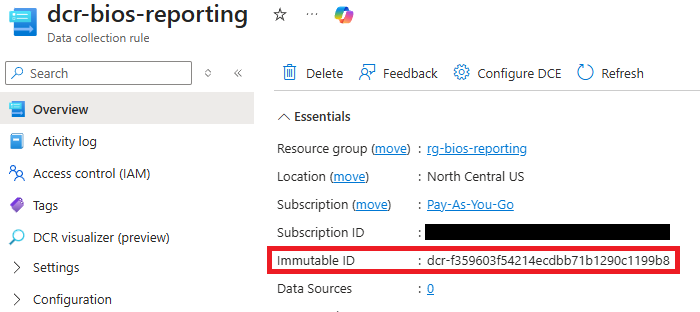
SummaryDcrImmutableId | DCR > Overview > immutableId (Image below this table). |
DetailDcrImmutableId | The same immutableId, both streams share one DCR. (Different value only if you used two DCRs.) |
SummaryStream | Custom-BiosManagementRun_CL |
DetailStream | Custom-BiosSettingsDetail_CL |
Next steps
The infrastructure is ready: a workspace with two custom tables, an endpoint and rule to populate them, and an app-plus-certificate identity authorized to publish. Nothing is flowing yet. The detection scripts have reporting off by default.
The next post: Querying BIOS fleet data with Log Analytics and KQL turns reporting on in the scripts using the values from Step 9, explains the two-table data model and the cost controls that keep it inexpensive, and walks through KQL queries against the data.