This is the third post in the Intune BIOS Reporting series The first post covered the output format and the no-infrastructure reporting; the second built the Azure infrastructure. This one turns the Log Analytics reporting on, explains the data model, what it costs, and shows the KQL it enables.
With the workspace, tables, app, and certificate from the setup post in place, the detection scripts can send a structured record on every run (full per-device, per-setting picture, queryable with KQL).
Turning reporting on
Reporting is off by default and configured in the detection scripts. The remediation scripts never emit; all reporting comes from detection, so it reflects the state the device is actually in, on detection’s schedule. Reporting is enabled by editing the script body before you upload it, since remediations cannot take command-line parameters.
Near the top of each detection script is a reporting block. Fill in the values you gathered in Step 9 of the setup post and set $ReportingEnabled to $true. The settings detection scripts look like this:
$ReportingEnabled       = $true
$ReportingDepth         = 'Managed'   # Summary | Managed | Full
$ReportingHeartbeatDays = 7
$ReportingConfig = @{
    TenantId              = '00000000-0000-0000-0000-000000000000'
    ClientId              = '11111111-1111-1111-1111-111111111111'
    CertThumbprint        = 'A1B2C3D4E5F6...'
    DceUri                = 'https://dce-bios-reporting-xxxx.<region>.ingest.monitor.azure.com'
    SummaryDcrImmutableId = 'dcr-aaaaaaaaaaaaaaaaaaaaaaaaaaaaaaaa'
    SummaryStream         = 'Custom-BiosManagementRun_CL'
    DetailDcrImmutableId  = 'dcr-aaaaaaaaaaaaaaaaaaaaaaaaaaaaaaaa'
    DetailStream          = 'Custom-BiosSettingsDetail_CL'
}
The password detection scripts use the same block without the depth and detail-table fields. Password runs are summary-only, so there is nothing per-setting to send:
$ReportingEnabled       = $true
$ReportingHeartbeatDays = 7
$ReportingConfig = @{
    TenantId              = '00000000-0000-0000-0000-000000000000'
    ClientId              = '11111111-1111-1111-1111-111111111111'
    CertThumbprint        = 'A1B2C3D4E5F6...'
    DceUri                = 'https://dce-bios-reporting-xxxx.<region>.ingest.monitor.azure.com'
    SummaryDcrImmutableId = 'dcr-aaaaaaaaaaaaaaaaaaaaaaaaaaaaaaaa'
    SummaryStream         = 'Custom-BiosManagementRun_CL'
}
Update each detection script you deploy, then upload to the Intune remediation. With a single shared DCR, SummaryDcrImmutableId and DetailDcrImmutableId hold the same value (see the setup post).
Important
Reporting is isolated from the compliance reporting. If the token request fails, the certificate is missing, or the network is down, the script logs a warning and continues. The detection result and exit code are never affected. A broken reporting pipeline can never make a device report the wrong compliance state. The values above are all non-secret; the only secret is the certificate’s private key, which lives in the device’s certificate store, never in the script.
The data model
Every emission writes one summary row, and settings runs also write a detail row per managed setting. The two tables join on RunId.
BiosManagementRun_CL - one row per run. It carries the device facts (name, the stable SMBIOS UUID as DeviceId, manufacturer, model), the Component (Settings or Password), and the run’s outcome: OverallTag, the counts (ManagedCount, CompliantCount, DriftCount, UnsupportedCount, FailedCount, BlockedCount), the full DriftNames list (no line-length cap here, unlike the console output), and for password runs the PasswordVersion and CertThumbprint. Settings runs leave the password fields empty and vice versa. BlockedCount is the count of cached-failed settings whose failure points at blocked management (a wrong/missing password, a thrown write) rather than incompatible hardware. This is the same value behind blocked= on the output line.
BiosSettingsDetail_CL - one row per managed setting on a settings run: SettingName, DesiredValue, CurrentValue, PerSettingStatus (Compliant / Drift / Failed / Unsupported), FailReason (why a Failed setting failed; access-denied, invalid-param, write-threw, and so on; empty otherwise), a Managed boolean, and the SetDate. Each row carries the RunId of the summary it belongs to.
Because the summary carries the rolled-up counts and the detail carries the per-setting breakdown, most dashboards read only the small summary table, and you reach into the detail table when you want to know which settings drifted or what value a setting holds across the fleet.
Data volume and cost
Three knobs decide how much data flows. Two are about richness, one is about frequency.
Depth ($ReportingDepth, settings only) sets how much detail each run sends:
| Depth | What it sends |
|---|---|
Summary | The run row only, no per-setting detail. |
Managed (default) | The run row plus a detail row for each managed setting (the ones in $DesiredSettings that the BIOS exposes). |
Full | The above, plus a detail row for every other BIOS setting as asset inventory (Managed = false). This can be a hundred-plus rows per device. |
Emit-on-change with a heartbeat is the option that keeps steady-state nearly free. The script hashes the reportable state and writes that hash to a marker (…\FirmwareManagement\Reporting\<Component>). On the next run it only sends a record if the hash changed (a setting drifted, a password rotated, the desired state was edited) or if $ReportingHeartbeatDays have passed since the last send. A device that is sitting compliant sends one baseline record at rollout and then nothing but a weekly heartbeat, no matter how often detection runs.
Important
Keep the heartbeat shorter than the workspace retention. The heartbeat is what keeps a stable device visible in queries; if a device only re-emits every 30 days but your tables retain 14, stable devices fall out of the query window and look like they vanished. Seven days against the default retention is a safe starting point.
Cadence makes the biggest cost difference. Ingestion is billed per GB, and the data is small, so the bill is really a function of how many records you send. Emit-on-change means detection can run as often as you like for compliance while reporting stays quiet. Sending “rich data” is fine, it’s sending rich data constantly that can get expensive. The table-plan split from the setup post helps here: the summary table is on the Analytics plan (small, hot, good for dashboards and alerts) and the detail table is on the Basic plan (much cheaper to ingest, billed per GB scanned when you query it).
To put rough numbers on it for a 10,000-device fleet (confirm current per-GB rates for your region), Analytics is roughly $2.30/GB and Basic roughly $0.50–0.65/GB:
| Pattern | Approximate ingest cost |
|---|---|
Managed depth, daily | ~$4/month (Analytics) |
Full depth, daily | ~$40/month Analytics + ~$9/month Basic |
Full depth, hourly | ~$1,000/month - avoid |
Note
The Analytics plan also includes the first 5 GB per workspace each month free, so real bills for small volumes often run lower. Rates change over time, so confirm the current figures for your region on the Azure Monitor pricing page before budgeting.
The takeaway: pick the depth you need, lean on emit-on-change, and do not run Full depth on a tight cadence. For most fleets, Managed depth with emit-on-change and a weekly heartbeat is both the cheapest and the most useful.
Note
Basic-plan tables support KQL with a reduced operator set and are billed per GB scanned at query time rather than queried for free. That fits the detail table’s role, occasional deep dives, not constant dashboarding. Keep your frequent, broad queries on the summary table and reach into the detail table deliberately.
Querying the data
The tables are queried from the workspace’s Logs blade. I’ve included a few queries to start from. The table names carry the _CL suffix that Log Analytics adds to custom logs.
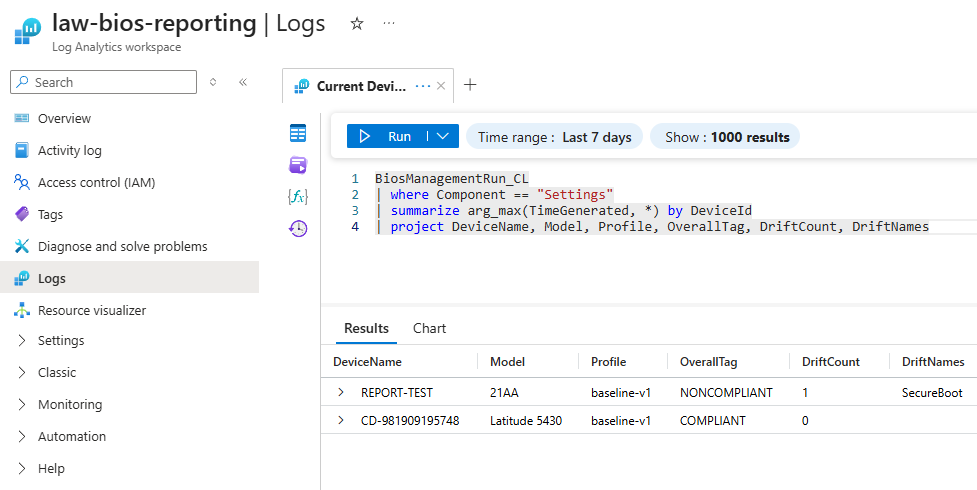
The current state of every device (latest settings run each):
BiosManagementRun_CL
| where Component == "Settings"
| summarize arg_max(TimeGenerated, *) by DeviceId
| project DeviceName, Model, Profile, OverallTag, DriftCount, DriftNames
Devices currently drifting on a managed setting:
BiosManagementRun_CL
| where Component == "Settings"
| summarize arg_max(TimeGenerated, *) by DeviceId
| where DriftCount > 0
| project DeviceName, Model, Profile, DriftCount, DriftNames
Devices where management is blocked - settings that failed for a fixable reason (a wrong/missing password, a thrown write) rather than incompatible hardware.
BiosManagementRun_CL
| where Component == "Settings"
| summarize arg_max(TimeGenerated, *) by DeviceId
| where BlockedCount > 0
| project DeviceName, Model, Profile, BlockedCount, OverallTag
Why a setting is failing - the specific reason per device and setting (detail table):
BiosSettingsDetail_CL
| where PerSettingStatus == "Failed" and isnotempty(FailReason)
| summarize arg_max(TimeGenerated, *) by DeviceId, SettingName
| project DeviceId, SettingName, DesiredValue, CurrentValue, FailReason
Note
Two things to expect with these fields. First, only detection emits, and it reports the state at detection time. The first cycle that finds drift hasn’t been remediated yet, so the failure and its
FailReasononly land on the next detection cycle (after the remediation has written the marker). Second, a bad value is recorded asinvalid-param, which is deliberately not counted as blocked: it populatesFailReasonin the detail table but leavesBlockedCountat0. To seeBlockedCount > 0, you need a genuinely blocked case such as an authorization failure (access-denied).
The most common drift across the fleet - which settings are non-compliant most often (detail table):
BiosSettingsDetail_CL
| where Managed == true
| summarize arg_max(TimeGenerated, *) by DeviceId, SettingName
| where PerSettingStatus == "Drift"
| summarize devices = count() by SettingName
| sort by devices desc
How one setting is configured across the fleet - useful for an audit (every device’s current value for SecureBoot):
BiosSettingsDetail_CL
| where SettingName == "SecureBoot"
| summarize arg_max(TimeGenerated, *) by DeviceId
| summarize devices = count() by CurrentValue
Drift detail for the latest run - joining the summary and detail tables by RunId to see exactly which settings are off and what they should be:
BiosManagementRun_CL
| where Component == "Settings"
| summarize arg_max(TimeGenerated, *) by DeviceId
| join kind=inner (
    BiosSettingsDetail_CL
    | where PerSettingStatus == "Drift"
  ) on RunId
| project DeviceName, SettingName, DesiredValue, CurrentValue
Password version spread - how many devices are on each version (a clear view of a rotation rolling out):
BiosManagementRun_CL
| where Component == "Password"
| summarize arg_max(TimeGenerated, *) by DeviceId
| summarize devices = count() by PasswordVersion
Password exceptions - every device whose latest password run was not compliant (drifted, missing marker, BIOS reset, incompatible):
BiosManagementRun_CL
| where Component == "Password"
| summarize arg_max(TimeGenerated, *) by DeviceId
| where OverallTag != "COMPLIANT"
| project DeviceName, Model, OverallTag, PasswordVersion
Compliance over time - a trend line for a settings profile:
BiosManagementRun_CL
| where Component == "Settings"
| summarize Compliant = countif(OverallTag == "COMPLIANT"),
            NonCompliant = countif(OverallTag == "NONCOMPLIANT")
    by bin(TimeGenerated, 1d)
| render timechart
Devices that have gone quiet - nothing received recently, accounting for the heartbeat (a device past two heartbeats is worth a look):
BiosManagementRun_CL
| summarize LastSeen = max(TimeGenerated) by DeviceId, DeviceName
| where LastSeen < ago(14d)
| sort by LastSeen asc
From here the usual Log Analytics tooling applies: pin a query to an Azure dashboard, build a workbook, or set an alert rule on the summary table (for example, when password exceptions climb above a threshold).
Note
The field names are emitted exactly as the tables define them (DCR-based custom tables keep names as-is, with no type suffixes).
RunIdis a string,Managedis a boolean, the counts are integers, andTimeGenerated/SetDateare datetimes, so the queries above work without any type juggling.
Without deploying a certificate
The push pipeline needs the ingestion certificate on each device. If you would rather not deploy one, there is a lower-fidelity alternative that uses no device credential at all: pull the remediation run states from Microsoft Graph on a schedule (with an Azure Automation runbook or Function) and land them in your own store. The catch is that Graph only exposes what Intune surfaces (the single output line) so you get the tag and the key=value fields, but none of the structured per-setting detail the push pipeline provides. It is a reasonable fit when you want central data without touching device certificates and the output line is enough. For the full per-setting picture, the push is the way.